
Level 1
 The Level 1 record keeping module is designed for producers that are new to record keeping or who may already keep records but are unsure of what information is worth keeping or how these records can be used. The Level 1 module will provide guidance on records to keep for animal health and performance, forage and grasslands, genetics and finances.
On this Page
- Animal Health and Performance
- Health Treatments and Withdrawal Times
- Forage and Grasslands
- Genetics
- Financial
Animal Health and Performance
 GOLD Management Indicators
The acronym GOLD stands for Growth of calves; number of Open cows; Length of calving season and calf Death loss. Whether you use a computer system or complete records by hand, each of these measures can be determined for your operation and compared to industry benchmarks for the same indicators. By comparing your numbers to benchmarks for the industry averages you can assess areas where you may need to make improvements.
Growth of Calves = Weaning Weights or Sale Weights
|
Total lbs weaned ÷ number of head weaned = average weaning weight (lbs) |
Over the last 20-30 years there have been gains in the cow/calf sector with weaning weights steadily increasing. A 5 lb increase in average weaning weights has been shown to decrease cost of production (COP) by $6.75/head4.
|
Regional Benchmark West: 570 lbs Ont: 660 lbs Atl: 527 lbs |
Data to record: the actual total number of weaned calves, sale weights or weights collected at weaning time.
When to record it: Collecting the number of weaned calves can take place at weaning when separating calves from dams. The weight of the animals could be determined during processing or when the calves are sold. If calves are not sold following weaning and are entered into a backgrounding system instead, gathering the weights after separating calves from dams may be the best option for this calculation.
Growth is considered to be moderately heritable, influenced by both genetics and environmental factors including nutrition, health, dam performance and milking ability, and breeding decisions. Since many operations are only paid once per year after the sale of calves, improving weaning weights is one of the quickest ways to improve profitability by selling heavier calves.
Weaning weights can be recorded by using actual scale weights or by using sale weights if selling at weaning. Simply divide the total weight by the number of head to get an average number.
Example: The total weight for a group of 105 steers and heifers after the fall run is 65,205 lbs.
65,205 lbs weaned ÷ 105 steers and heifers = 621 lbs average weaning weight
Trade-offs: selecting cattle to produce greater weaning weights has been shown to impact cow size. This may result in larger framed females and higher feed costs in your cow herd.
Example Goals
- Weaning weights equal to 45% of cow weights by 2025
- Increase average weaning weights by 5 lbs by 2023
Open Rate (%)
|
Number of open females ÷ total number of females x 100% = Open rate |
Reproductive efficiency takes into account, among other factors, the number of calves born per the number of cows exposed. A 2% increase in reproductive efficiency decreases COP by $16.50/head4.
|
Industry Benchmark Less than 7% open |
Data to record: total number of females, number of open females
When to record it: record the total number of females in the breeding herd and the total number of open females at preg-checking.
Fertility is the greatest factor in herd productivity and is also a main driver of profitability. Cows that calve and re-breed every 12-months have the greatest impact on herd productivity. Infertility, or cows that don’t re-breed, can be caused by several reasons such as nutrition, disease, heat stress, mineral imbalance, or inferior genetics.
Feeding a cow during the winter accounts for 50% of the total cost to keep her in the herd. Pregnancy checking for open cows can help you make decisions that will save winter feed costs.
To determine the percentage of females in calf, divide the total number of females in calf by the total number of females and multiply by 100 to get a percentage. With this percentage, you can then compare your performance to other producers in your area or in Canada.
Example:
A herd has a total of 65 females. After vet palpation it was determined that 55 were safely in calf and 10 were open.
10 open females ÷ 65 total females exposed x 100% = 15% open females
For many operations, an ideal but unrealistic situation would be to have all 65 females in calf. The benchmark suggests that less than 7% of open females is a good target. A decision can then be made about what to do with the ten open females.
Example Goals:
- Less than 7% open females in 2021
- Sell open cows to reduce feed costs
Trade-offs: The open rate of a herd can vary depending on the management requirements of an operation. For example, a higher open rate may be acceptable for some operations due to labour costs or other factors such as the market price of cull cows.
To help producers choose the most economical option for their operation, the Economics of Pregnancy Testing Beef Cattle Model calculates the gain or loss per head when preg-checking and culling open cows in the fall compared to overwintering and culling in the spring.
Length of Calving Period
|
Last calf date – first calf date = length of calving period |
|
Industry Benchmark 63 days in length |
Data to record: dates of the first and last calf born on your operation
When to record it: record the dates when the first calf is born and when the last calf is born. At spring processing (aka branding) this will still be memorable.
The length of the calving period is another good measure of fertility within your herd. The ability to have more calves born in a shorter time period can produce a more uniform calf crop and can improve average weaning weight, as calves born earlier in the calving season will be heavier. It is also important to provide enough time for females to recover and begin cycling before rebreeding.
To measure the length of the calving period, count the number of days between the first and last calf. The target in an ideal situation is 63 days or three typical estrus cycles (21 days each).
Example:
For the herd of 65 females mentioned above, the calving period started with the first calf born on January 2, 2019. The very last calf was born on April 10, 2019. To determine the length of the calving period, count the number of days between January 2 and April 10, this equals 99 days total length.
There are online calculators available that will perform this calculation for you. The number of days can also be determined using formulas in spreadsheet software.
There could be many reasons why a calving period may be longer such as inability to remove the bull while on summer pasture, lack of facilities to pick up the bull, other farming activities. Calving periods, like open rates, may vary according to management needs.
A shorter calving period can improve uniformity and weaning weights because calves will be closer in age and will have a similar amount of time for weight gain compared to a calf crop where the calves are born over a longer period of time.
Calf Death Loss
|
Total calf deaths ÷ number of females that calved x 100% = calf death loss |
Death losses from calving to weaning in the cow/calf sector vary widely not only from operation to operation but also from year to year as they are impacted by herd health, weather, and predators. There are advantages to a smaller operation that can give more attention to a smaller herd if it reduces death losses. A 1% increase in death loss increases COP by $7.45/head4.
|
Industry Benchmark Less than 4% loss |
Data to record: the total number of calves lost from birth to weaning, the total number of females that calved or were expected to calve.
When to record it: record the number of calves lost as they happen until the last expected calf is born. The total number of females could be recorded at preg-checking.
Keeping track of calf losses can help you to identify where you might be having a herd health issue. For example, calves that die in the first 24 hours may be related to a management decision or other factors such as genetics, calves not getting enough colostrum, dystocia, weather, and predation. While calves that die between one day old and weaning may also be caused by illness, predation, weather, or calving hygiene, identifying where any death loss is occurring will help producers recognize management considerations to get more live calves.
Goals:
- Calf death loss is 4% or less in 2020
- Identify management changes that will produce more live calves
Example:
From a group of 55 females, there were 5 dead calves recorded.
5 calf deaths ÷ 55 females that calved x 100% = 9% calf death loss
The industry benchmark for death loss per year is less than 4%. This suggests that there may be an issue to correct before the next calving season which may be addressed by working with your veterinarian, nutritionist and livestock specialist to create an action plan.
Trade-offs: Let’s say an operation has a calf death loss of 7%. To reduce the number of early calf death losses on this operation, it is determined that it will require additional producer or staff time and labour to observe cows that are calving. The trade-off having higher staff costs or more time for the producer to monitor cattle more frequently may not outweigh the potential savings of more live calves.
Health Treatments and Withdrawal Times
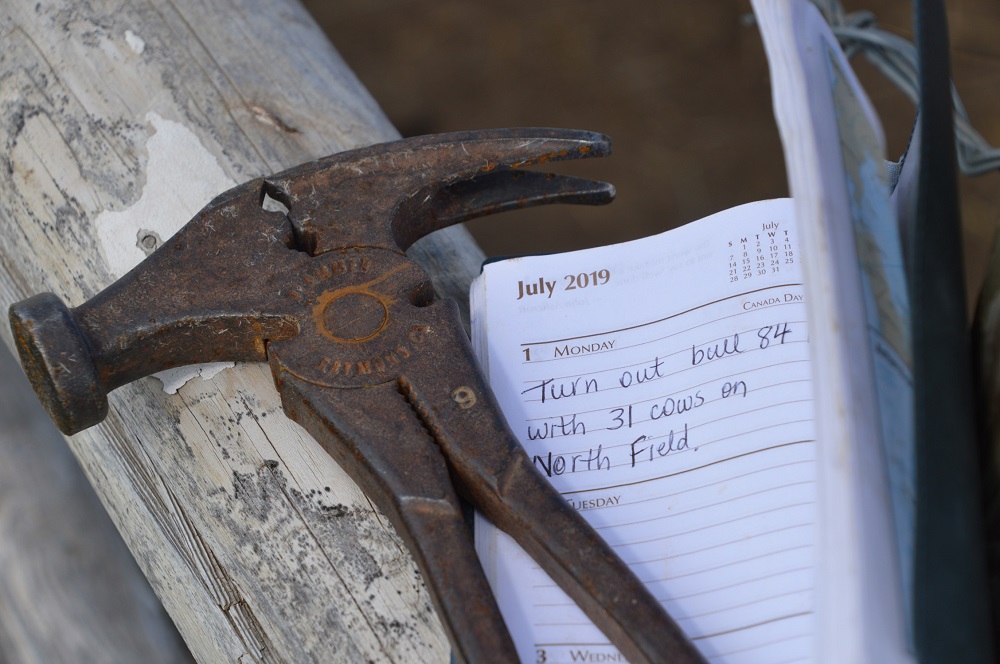
 Animal health records can be useful for making management decisions. Having readily accessible health records are also handy when marketing cattle to prospective buyers. They can also assist with culling decisions, for example, is this the second time or the third time you’ve treated this cow for lameness, and when is she safe to market?
Keeping track of your health treatments throughout the year can be useful information to have when evaluating your production goals. Recording information such as whole herd health protocols, calf birth and calf processing vaccination and treatment protocols could be used to clarify the impact these protocols are having on your performance measures. For example, it may be possible to relate a higher calf death loss to the health treatments typically given (or not given) at birth.
Cow-calf producers and feedlot managers have an important role to play in food safety. On-farm practices help to avoid certain food safety concerns such as chemical residues or broken needles at processing facilities to ensure the safety and confidence of consumers. It is through good on-farm food safety practises that Canada maintains an excellent reputation for food safety which increases consumer confidence both domestically and internationally. This is also a critical component when participating in export market opportunities.
To meet the requirements of on-farm food safety verification programs, including Verified Beef Production Plus (VBP+) or the Canadian Roundtable for Sustainable Beef (CRSB) pilot project, at least six months of records are required for cow-calf operations and at least three months of records are required for feedlot operations. These programs do provide sample record keeping templates you can use to get started.
Some suggested information to keep in your animal health treatment records include:
ID (Animal or Group): Whether you treated an individual or a large group, keep track of which animals were treated.
Treatment date(s): Recording the date of each treatment can be used to determine withdrawal times.
Treatment: The name of the product used.
Volume and route: The exact dosage delivered and by which route (intramuscular-IM, subcutaneous-SC).
Withdrawal date: The date the animal would be safe to ship according to the product label.
Table 1: Example of calculating withdrawal times
|
ID (Animal or group) |
Treatment Date (s) |
Treatment |
Volume and route |
Withdrawal date |
|
Cow with set of twins |
Jan 15, 2019 |
Metacam |
Sub-Q, 544 Kg gave 13.6 mL (2.5 mL per 100 kg) |
Feb 4, 2019 |
Individual Treatment
During calving, a producer gives a shot of Metacam to a cow that had a difficult calving with the set of twins on January 15th. The vet indicates that the withdrawal date for slaughter is 20 days. The twins died after calving and the producer decides to ship the cow. The earliest the cow can be shipped is February 4th.

Group Treatment
During the fall run, a producer treats a group of steer calves post weaning. The herd health plan from his veterinarian lists pour-on ivermectin and a modified live virus vaccine. To determine the withdrawal time for this group you would need to identify the treatment with the longest withdrawal time. In this case the ivermectin withdrawal time is 49 days. The withdrawal time for the group would be 49 days from the treatment date.
Forage and Grasslands
 The goals of good grazing management are to7:
- produce forage for livestock and wildlife
- maintain and protect soil from erosion
- capture and release water
- cycle nutrients and energy
- maintain biological diversity
One of the keys to a successful livestock operation is the proper use of pasture, either native rangeland or tame forages. To properly manage the land, a producer must be familiar with the amount of dry matter forage the pasture can produce and the amount of forage required over the grazing season by each animal and the herd as a whole.
With this knowledge, the proper combination of land, grazing period length, and number of animals can be chosen to ensure the sustained, long-term productivity of the pasture. Having an optimum number of animals on the pasture makes efficient use of the forage without waste, but still leaves enough forage to allow quick and complete recovery.
Range Health:
The basic principles of grazing management include:
- balance livestock demand with forage supply
- distribute grazing pressure
- provide effective rest periods
- manage livestock most suited to the forage supply and objectives
The following is a recommended list of information to get started in range health record keeping:
Pasture ID/ Location and Paddock ID: How you identify the location of each pasture, a name anyone working on your operation will recognize.
Acres (or Hectares): The number of acres (hectares) in the pasture identified. One free tool you can use to do this is Google Earth. This link provides step by step directions on how to use the platform to measure area: https://support.google.com/earth/answer/9010337?co=GENIE.Platform%3DDesktop&hl=en
Grass type:
Learning to recognize range plants and their role in the ecosystem is key to good range management.
Range plants can be grouped based on various characteristics including plant type, season of growth, origin, response to grazing and forage value.
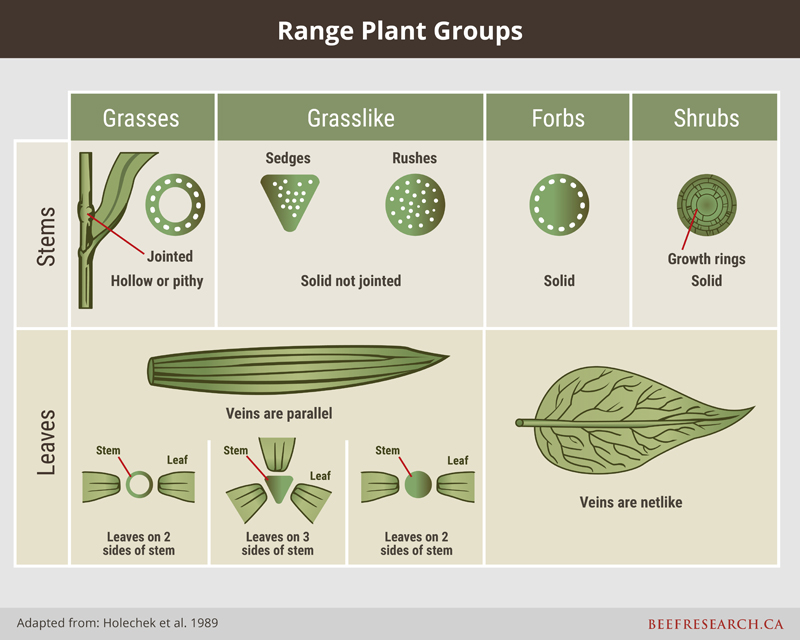
Click to enlarge
Rangeland Health Assessment
 Range health describes how the ecosystem is currently functioning compared to the potential for the site. This method evaluates five indicators including: plant community, structure, litter, site stability and weeds. Range condition compares the current plant community to its potential or “reference” plant community (known as the climax plant community). Four classes of range condition (Excellent, Good, Fair, Poor) explain how the composition of the present plant community has changed from that of the climax community.
Evaluating range health improves upon the original range condition approach by adding indicators, particularly for soil and site conditions, which producers can observe and are easier to measure than plant community alone. Rangeland health assessment tools have been developed to measure how well management principles and practices are being achieved. These assessments better address problems like irreversible changes in range condition and invasion of non-native species.
Assessing rangeland health starts by examining the existing plant community for desirability, diversity and density. Grazing severity, soil erosion, litter residue (dead plant material), disturbance and invasive species/noxious weeds are also taken into account in determining range health.
A sample Grassland Range Health Assessment worksheet is on the rangeland and riparian health page illustrating the evaluation of range health indicators and the steps taken to arrive at a range health score (Healthy = 75-100%; Healthy with Problems = 50-74%; Unhealthy < 50%).
For more additional information on evaluating range health by province:
- British Columbia Grazing Management Guide
- Rangeland Health Field Guide (Section 5)
- Alberta Range Health Assessment
- Saskatchewan Range Health Assessment Workbook (2008)
- Manitoba Range and Pasture Health Assessment Workbook (2017)
Tame Pastures
Pasture is a critical resource in the cattle industry. An effective management plan requires clear understanding of forage production, realistic production goals, effective grazing strategies and timely response to forage availability and environmental changes. Visit the grazing management page to learn more about grazing management on pasture.
The Alberta Tame Pasture Scorecard is one tool available that can help you visually assess your tame pasture ranking (low, medium, high) using the following indicators: plant population, plant density, plant vigour, legumes present, weeds and bush present, ground cover, soil damage, nutrient cycling, severity and uniformity of use. Although this is an example from Alberta, the core components are applicable across Canada. Table 2 provides descriptions used in classifying tame pastures (Excellent, Good, Fair or Poor).
Table 2. Tame pasture class definitions
|
|
Excellent |
Good |
Fair |
Poor |
|
Potential yield of the area |
75-100% |
60-75% |
50-60% |
33-50% |
|
Production from desirable, adapted grass and legumes |
95% |
90% |
60% |
Less than 50% |
|
Production from weeds or undesirable plants |
Less than 5% |
Less than 10% |
20% or more |
50% or more |
Source: Alberta Forage Manual (Table 37, page 206) adapted from Wroe et al. (1988) Guide to Range Condition and Stocking Rates for Alberta Grasslands
Genetics
 If you have completed the previous modules in Level 1, you may have already identified the areas of your operation where you would like to improve and have set some production goals. Once you know where you are, you can then start to plan where you would like to go. Maybe you want your calves to be heavier at weaning? Or you’re interested in more uniform coat colour, so that your calves fit into a certain market? While some of your goals will be influenced by your production practises such as feeding, other goals such as coat colour, will be largely impacted by genetics.
Straight-breeding, using a single breed on your farm, is one method of animal breeding that is easy to manage because you are only using one breed. There are different methods of doing this that are mentioned in the bull selection blog posts. While straight breeding is easier to manage, it is difficult for one breed to be efficient at everything. There is an advantage to crossbreeding, which is called heterosis or hybrid vigour. Hybrid vigor happens because crossbreeding overcomes the inbreeding depression that occurs in purebred or straight-bred populations and it combines good attributes of two or more different breeds.
If one of your goals is to sell calves at weaning it would make sense to use a breed, such as a Continental or exotic breed, which will maximize direct weaning weights. However, a straight-bred system like this system might maximize outputs but may require large inputs (feed) as well. With that in mind, perhaps it would make more sense from an economic perspective to use a British breed as the genetic base for all dams and use a continental breed for sires, or use the existing cow herd and capture added growth in the calves via the sire, which could reduce the input costs from the female side yet still capture added growth in the calves due to the direct growth provided by the sire breed. This is a simple example of a crossbreeding system.10
Why crossbreed? Studies have shown in crossbred calves7:
- 3% more calves survive to weaning
- 5% greater weaning weight
- 6% greater yearling weight in steers
- 10% of heifers show first estrus earlier than straight-breds
To improve the genetics in your herd, you need to identify your production goals and weigh them against your existing herd. Are you looking to maximize carcass characteristics and could source genetics that result in a terminal cross? Do you want to optimize feeding efficiency? Do you plan on retaining heifers and want to incorporate maternal traits? To improve the hybrid vigour in your herd, one place to start is by identifying which type of breeding system could work best for your operation based on factors such as:
- the management style of the operation
- your production goals
- feed availability
- heifer retention (i.e., terminal versus maternal sires)
- production environment
- number of breeding fields available
- time of marketing
- availability of high-quality bulls
Methods of Specific Breed Crossing
There are several ways in which hybrid vigour can be achieved in a calf crop. The following are a few of the methods where hybrid vigour can be achieved:
Terminal crossing is when females are bred to a sire from a breed known for meat traits known as a terminal sire. This type of cross is used for breeding feeder calves and shouldn’t be used for replacement heifers due to large mature size or excessive muscling. This means you may need to buy all of your replacements or have a separate herd that is bred for replacement females.
Two-way rotation uses two sire breeds (e.g. Simmental and Limousin). The heifer calves are kept and bred to the other sire breed. This system requires two pastures or groups and it is possible to achieve approximately 67% of the maximum amount of heterosis or hybrid vigour.
Three-way rotation uses three breeds, but it works best when these breeds are not strictly maternal or terminal. Part one of the bull selection blog post series provides further information on breeding strategies.
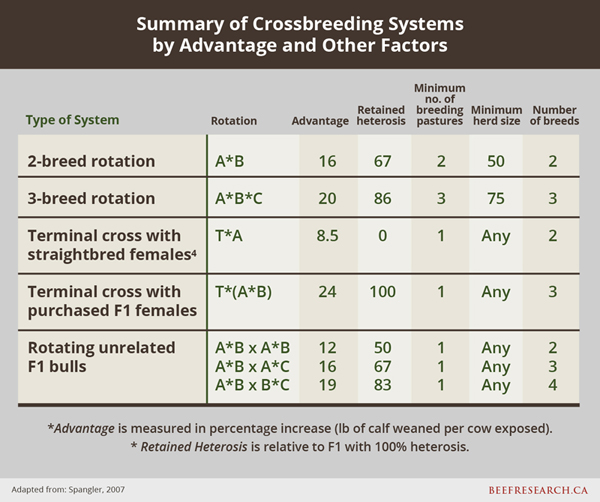
The following table is a summary of the various crossbreeding systems that can be used to achieve hybrid vigour. The type of system that you use will depend on:
- Number of females. You want to ensure you are maximizing resources such the number of females per bull.
- Number of breeding pastures available
- Number of breeds currently within the breeding herd that match the genetic potential of the target market
Click to enlarge
Table source: Spangler, 2007 https://beef.unl.edu/beefreports/symp-2007-21-xx.shtml
How can you decide which breeds to use in your breeding system?
The following figure is a good visual of how closely some of the most common beef breeds are related. The different branches show which breeds are most genetically similar. For example, AN and AR represent types of Angus cattle that are all on the same branch. On the opposite side, HL and HH representing Hereford lines are on the same branch. The breeds that some refer to as Continental including Simmental (SM), Limousin (LM), Charolais (CH) and Gelbvieh (GV) are on another large branch. Breeds like Brahman (BR) are well outside the other breeds.
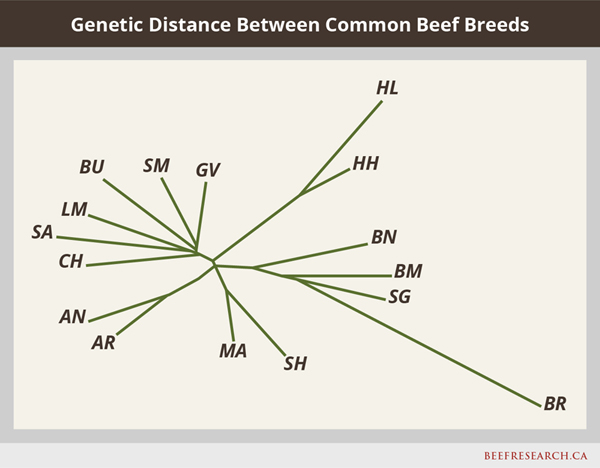
Breeds are Angus (AN), Hereford (HH), Line 1 Hereford (HL), Red Angus (AR), Shorthorn (SH), Braunvieh (BU), Charolais (CH), Gelbvieh (GV), Limousin (LM), Maine-Anjou (MA), Salers (SA), Simmental (SM), Beefmaster (BM), Brahman (BR), Brangus (BN), and Santa Gertrudis (SG)9.
Data to record: Breed(s) of herd sires used each breeding season, breed composition of females in the breeding herd
When to record it: Record sire breed information at turn out. Record the breed information of females at birth or purchase.
Example: You have decided that you would like to produce a group of calves that will produce a higher weaning weight. Your group of 60 cows is primarily a mix of Angus and Hereford and make the decision to purchase two Limousin bulls that are known for carcass traits (terminal sires). The following year, all of the steer and heifer calves are sold in the fall. This has resulted in a year without producing any replacement females.
For the next breeding season, you decide to purchase an Angus bull to breed what you believe are your 15 best females with the intent to produce daughters from those females as replacements. The two Limousin bulls are then used to breed the remaining 45 females.
Example Goals:
- Select bull(s) of the right breed(s) to achieve goals
- Improve hybrid vigour in feeder calves by using a terminal sire
- Identify the breed composition of the breeding herd before next breeding season or bull purchase
Trade-offs: As mentioned in the example above, using terminal sires may not produce the optimal traits in replacement females for your operation. This could result in the need for multiple bulls and pastures.
Financial
Keeping your farm financial records up to date can be one of the most effective ways to measure profitability and achieve a higher return for your effort. Preparing and understanding your operation’s financial situation is an important step.
|
Some of the benefits of keeping financial farm records accurate and up to date:
|
The type of information your records contain will depend on your situation and other factors such as8:
- Business type: whether you are full time, part-time or hobby farm
- The format you use to keep your records (paper, electronic or a combination of the two)
- If you have converted any paper records or supporting documents into an electronic version
- If you are involved in e-commerce such as online sales
- If you are a GST/HST registrant
- If you are an employer
For many producers, you may not have a lot of background in accounting practises or have the time available to do your own accounting. Hiring an accountant, bookkeeper and/or tax advisor may be worth the investment for your operation. This can also ensure your business is up to date with any yearly changes to Canada’s agricultural tax codes; saving the farm time and money. Before meeting with an advisor there are some things you can do ahead of time to save time and money:
- Store all documents (receipts, invoices, statements, etc.) in one location. This will make the information you need easier to find and save you some time later.
- Separate documents according to category (income, expenses, payroll etc.). This will again save some time but will save you some dollars because your accountant will charge you to do this.
- Speak with an accountant about the goals for your operation. Your accountant can help you reach your goals and make a financial plan for the next year.
- Meet with tax advisors to help navigate the system and make the best choices for your operation.
- Review your financial records quarterly or annually to compare to your financial goals.
- Keep an up-to-date list of items that will depreciate in value such as buildings and equipment.
For more information about what can be claimed on your taxes in Canada, visit the CRA website.
For more information about specific records to keep for income tax purposes, the CRA has an in-depth section on their website.
Feedback
Feedback and questions on the content of this page are welcome. Please e-mail us.
Record Keeping Version 1.0 January 2020