
Forage Quality
Matching forage quality to animal needs is part of cattle management as nutrient requirements of cattle change throughout the year based on the stage of the production cycle. When feed grain prices are high, a high-quality forage can provide a lower cost ration than a low quality forage supplemented with a concentrate. Failing to provide all the nutrition a cow needs due to low quality forage can have animal health and performance consequences that directly impact cost of production (COP) (e.g. loss of body condition, dystocia, lower milk production, and delayed returning to estrous). This can be largely avoided by feed testing, particularly when hay is of an unknown quality.
Stage cut, fertilization and grazing intensity determine forage quality, and it refers to the plant’s ability to provide digestible, absorbable, essential nutrients at levels that meet the animal’s physiologic needs. Forage quality is a function of voluntary intake and nutritive value (nutrient content and digestibility).1 It is typically assessed by measuring crude protein (CP), neutral detergent fibre (NDF), and acid detergent fibre (ADF) (Kerley 2004)2
On this page:
Protein and Energy
Proteins and energy are the most essential nutrients in cattle diets. Crude protein (CP); calculated from total nitrogen content, is an important indicator of the total protein content in a forage crop. A higher CP level typically indicates higher forage quality, but it is not the ultimate measure. In fact, the energy value of forage is often the most limiting attribute for meeting an animal’s requirements in most forage-based feeding.3 However, energy content (usually expressed as Total Digestible Nutrients; TDN) is more difficult to measure and depends on the digestibility of various chemical fractions of forage. The most common method of predicting forage energy content is based on amount of fibre (Newman et al. 2009).4
Fibre
Neutral detergent fibre (NDF) and acid detergent fibre (ADF) are measures of the fibre in forage and are both negatively related to forage quality. NDF measures the amount of cellulose, hemi-cellulose, lignin and insoluble ash in a plant and provides an indication of the potential voluntary intake of the animal. As the NDF increases, animals will be able to consume less forage. ADF measures the amount of cellulose, lignin and insoluble ash and is a good indicator of digestibility and thus energy intake. As ADF increases, digestible energy levels decrease.5
Importance of Forage Quality
 Forage quality has direct effects on animal performance and, ultimately, profitability. A common belief is that cows can simply eat more low quality forage to meet their energy demands. This is not true in most cases since the higher fibre content in low-quality forage decreases voluntary intake.6 Forage with low protein content (7% or less), high acid detergent fibre (ADF) and neutral detergent fibre (NDF) cannot meet the nutritional needs of many, if any, classes of livestock without supplementation. Sometimes making hay of this quality cannot be avoided due to weather, but often times it can through proper management, as outlined below. In contrast, feeding high quality forage typically means no supplementation is needed other than minerals to meet nutrient requirements for most cattle. Harvesting and feeding high quality forage, may avoid many programs (e.g. loss of body condition, dystocia, lower milk production, and delayed returning estrous) that are hard to economically quantify.
Factors Affecting Forage Quality
Species
Forage quality varies among different species. Legumes generally produce higher quality forage than grasses as they usually have less fibre and favor higher intake than grasses.7 A study conducted by Kopp et al. (2003) in Manitoba shows that alfalfa-meadow bromegrass pastures often had higher CP than grass-only pastures during the experiment period. On average, alfalfa-grass mixture has 13.3% CP in the first cut compared to 8.3% in pure grass. The alfalfa-grass mixture also has lower NDF and ADF levels compared to pure grass which is important to maximize voluntary forage intake by grazing animals. Studies also show that cool-season species are generally higher in quality than warm-season grasses; while annual grasses are often higher in quality than perennials (Collins et al. 2001).
Maturity
Maturity at harvest is one of the most important factors determining forage quality of a given species. As one would expect, quality values were highest while the forage was young and declined as it matured. Studies show that cool season grasses often have dry matter digestibility above 80% during the first two to three weeks after growth initiation in spring. Thereafter, digestibility declines by one-third to one-half percentage units per day until it reaches a level below 50% (Collins et al. 2001).8 A one week delay in harvesting alfalfa (Medicago sativa L.) decreased digestibility and crude protein concentration by 2% and increased cell-wall concentration by 3% (Buxton, 1996).9 Similar results were also found in studies conducted in eastern Canada on cereal forages.
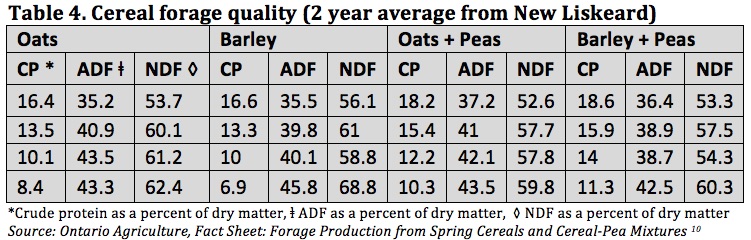
Table 4 shows how ADF and NDF increase as crude protein decreases. Therefore, timely harvest of forage is critical to maintain high quality feeds. Cutting in late afternoon when forages sugar content are highest is also recommended. Waiting until tonnage increases, to harvest more hay per acre, may result in low quality feed that does not meet livestock's nutritional needs. To meet nutrient requirements of these animals, a concentrate supplement should be fed.
Other
Other factors affecting forage quality include harvest and storage condition, fertilization, and weather.
Impact of Ration Costs
Matching forage quality to animal needs is also an important aspect of cattle management as nutrient requirements of cattle change throughout the year based on the stage of the production cycle. For example, the average cow requires 55% TDN and 7% CP during mid-pregnancy, 60% TDN and 9% CP during late pregnancy and 65% TDN and 11% CP after calving. If the cow's diet is completely made up of forage, her energy requirement must be met by the forage as well.11
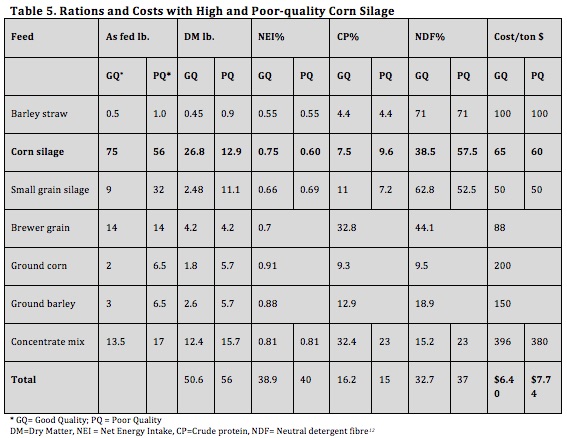
Forage quality affects the nutrient content of the diet and ultimately feeding costs. Table 5 shows results from a study (R.E. James 2013) using good and poor quality corn silage and how it impacted ration costs. Good quality corn silage resulted in less corn, barley and concentrate required and ultimately a lower cost ration. There will be times when feed grain is cheap compared to good quality forage and it will be desirable to increase the amount of concentrate in the diet while using a poor quality forage. But growing good quality forage can eliminate the need to supplement is some situations.
Determining Forage Quality
A sound theoretical definition for forage or feed quality is animal performance. Voluntary intake and nutrient digestibility have been used to form indices of forage quality, and most feeding standards and models are based on the assumption that animal performance is related closely to intake of available nutrients. Due to variation in measurements of intake, digestibility, and animal performance, however, relationships used to develop prediction equations for animal performance from intake and digestibility are often less accurate than desired. To be useful in livestock feeding, forage quality information must be available before feeding. Therefore, prediction of forage quality from feed attributes taken from small samples is necessary (Coleman and Moore, 200313).
Relative feed value (RFV)
The Relative Feed Value (RFV) was developed by the Hay Marketing Task Force of the American Forage and Grassland Council (Rohweder et al. 197814). As early as 1982 (Turnbull et. al.15) it was noted that RFV was a better gauge of alfalfa hay instead of quality grade when animal performance was examined.
Buyers and sellers require an accurate and effective way of communicating the quality of hay using a method that best describes the feed value to livestock. Protein content has been used as a measure of hay quality. However, other factors, such as fibre content, which influences digestibility and intake, also need to be taken into account when determining forage quality. RFV attempts to use a single value to describe forage quality, and has become a common tool for determining hay quality (intake and energy value) and in pricing hay. Relative Feed Value can also be used to determine the quality of standing alfalfa hay. This allows producers to determine the appropriate harvest date of their alfalfa to suit their feed needs.
Limitations of RFV
Although RFV provides a convenient way of comparing alfalfa hay quality and predicting feed value in the field, the concept does have some limitations. It is only useful for comparing alfalfa forage. It cannot be used for comparing grass or alfalfa-grass forage due to the fact that grass does not have the same developmental stages of alfalfa and the nature of grass fibre is different than that of alfalfa.
ADF and NDF are the only laboratory values used in the calculation. Crude protein concentration of forage is not used. The RFV of the forage must be balanced with the fibre requirements of the type of animal being fed. Therefore, RFV cannot be used in ration formulation or evaluation. Since RFV was developed using legume forages and intake responses of lactating dairy cows, it works best when applied to that situation.
Calculating RFV
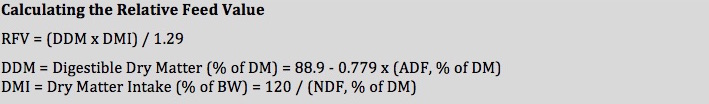
The numerator 120, in the DMI calculation indicates maximum feed intake in alfalfa based dairy rations when NDF is 1.2 lbs per 100 lbs of body weight. The divisor 1.29 in the RFV calculation provides an RFV index of 100 when alfalfa is in full bloom. A method of predicting Relative Feed Value can be found at http://www.agriculture.gov.sk.ca/Default.aspx?DN=1b3ff05b-e399-48cc-a1ba-2ae03cbfc7be
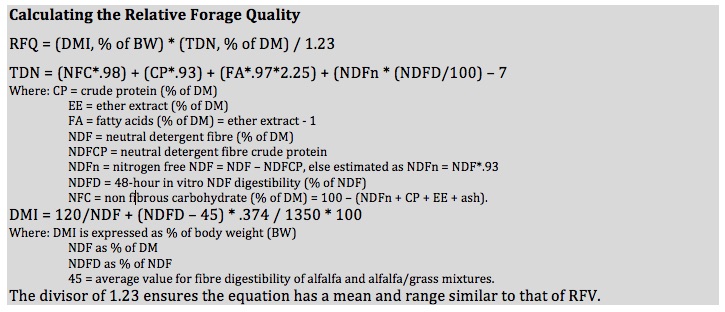
Relative forage quality (RFQ)
As new technology and information becomes available with Near Infrared Reflectance Spectroscopy (NIRS) and in vitro digestion in forage testing there have been recommendations on how to improve forage quality measurement. Differences in digestibility of the fibre fraction can result in a difference in animal performance when forages with a similar RFV index are fed. The Relative Forage Quality (RFQ) index was developed to overcome this difference (Jeranyama and Garcia 2004) and provide a methodology that could be used in calculating rations (Moore and Undersander, 200216).
Fibre from grass and legumes naturally differs in digestibility, as it also does when grown under different ambient temperatures. RFV of first-cutting alfalfa will be similar to that of second and third cuttings harvested at similar stages of maturity. However, fibre digestibility from each cutting will be different, as this is influenced by ambient temperatures at the time of growth and development. Therefore, differences in fibre digestibility are not taken into account in the RFV calculation and cows may perform differently when fed forages from different cuttings. The RFQ takes these differences in fibre digestibility into account as well as differentiating legumes from grasses.
The inclusion of Neutral detergent fibre in grasses makes RFQ a better predictor of forage quality than RFV17. However, there are challenges with implementation. Forage testing laboratories must match the type of forage being tested with the appropriate equations for DMI and TDN as well as communicating what RFQ is and how it can be used must be done to laboratories, producers, and extension specialists.
Calculating RFQ
Feedback and questions on the content of this page are welcome. Please e-mail us.
This topic was last revised on February 29, 2016 at 9:02 AM.
Related Topics
Related Blog Posts
Fact Sheets
-
In Progress.
Results expected in March 2022.
Enhancement of total lipid content/composition in non-GMO alfalfa and sainfoin for improved energy density and reduced methane emissions
 View Web Page
 View PDF
-
March 2018
Improving barley and triticale feed
View Web Page
View PDF
-
In Progress.
Results expected in March 2022.
Improving vegetative biomass yield and digestibility in alfalfa for enhanced livestock production.
View Web Page
View PDF
-
In Progress.
Results expected in March 2023.
Measuring Forage Quality of Hybrid Fall Rye
View Web Page
View PDF
-
March 2011
Forage Variety Yield and Quality Differences
by Alberta Beef Producers
View Web Page
View PDF
-
May 2013
Improved forage oats
by Alberta Beef Producers
View Web Page
View PDF
-
November 2018
Improving the Digestibility of Hybrid Brome
by Alberta Beef Producers
View Web Page
View PDF
-
May 2018
Improving the Energy Content of Legumes
by Alberta Beef Producers
View Web Page
View PDF
-
April 2012
Increasing Silage Yield and Quality
by Alberta Beef Producers
View Web Page
View PDF
-
December 2012
Silage Variety Yield and Quality Differences
by Alberta Beef Producers
View Web Page
View PDF